CHEVRON & GE Energy Strategy
Agency: Frog Design
Role: Lead Visual & UX, Co-Facilitator & Concept Generation
The problem we were solving in this project was to help GE & Chevron leadership define the benefits of a new sensor technology to their field workers to increase adherence as well as define valuable data and tasks that would be aggregated into a SaaS dashboard for the crew.
Connecting infrastructure via sensors and wireless networks is cheap and easy, but understanding the human motivations, desires and values underpinned by the Internet of Things was the challenge. In order to build adherence, we needed to find what was valuable to the field worker. In order to build a dashboard that increased efficacy and increased ease task completion, we had to look at the Industrial Internet through the lens of human behavior, methodologies and frameworks in Design Thinking.
The first task was research and understanding the space. Working with a great collaborative frog team we ensconced ourselves in the world of oil, gas and energy, I dove into scientific research and the new technology to aid in recovery and efficiency of oil wells. In this project I was leading up visuals and user experience and supporting our workshop with GE and Chevron.
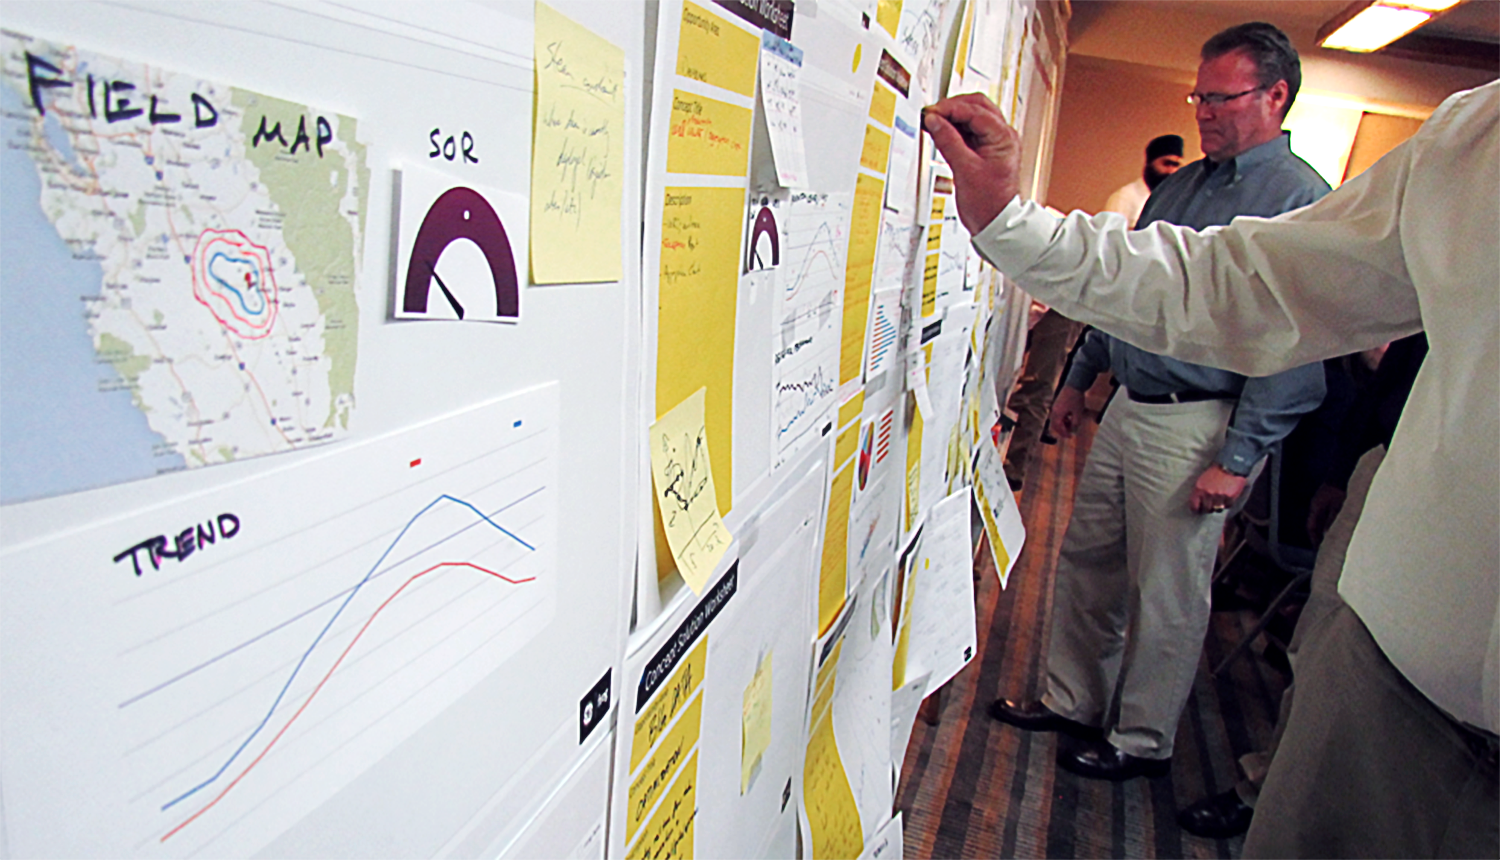
The second task was to build on employee knowledge and build out the information needed through Design Thinking Workshops. The workshop was designed to reveal how this new technology would be utilized by the Chevron employees in the oil well fields. We brought together Chevron and GE employees to answer strategic questions helping us define the product’s use, acceptance of new technology by field workers, how to create more efficiency and role/task definition through JTBD, and explore innovation and opportunities by defining user unmet needs.
It was a puzzle of old systems, geology and exciting to problem solve efficiency through technology. I prioritized tasks vs technology feasibility in order to define data sets that were most important. Next I defined and validated top tasks, workflows and success criteria. Using GE’s template for SaaS dashboards I architected the experience using API populated data modules. Data visualization kept comparison information glanceable for a quick takeaway, while numerical charts and quick CTAs increased findability and Time-on-Task.
Our clients took away clear Role archetypes and JTBD, opportunities for trust and new sensor usage in addition to Energy and Usage management software for their teams to implement.


